1. Introduction
With the rapid urbanization progress around the world, traffic issue has drawn more and more attention regarding the city’s sustainable development. The traffic condition in New York City is particularly severe and the empty taxis on streets have worsened the traffic congestion, especially in rush hours. In this project, we want to explore the roaming empty yellow taxi conditions in NYC by applying big data techniques and we believe the discovery of empty taxi distribution may help alleviate the traffic burden and change the terrible traffic condition in NYC.
2. Data
- The taxi data used in this project were provided by Chris Whong, including all trip records of NYC yellow taxis in 2013. The attributes used and description of them were listed below:
- Tpep_pickup_datetime: date and time when the passenger was engaged
- Tpep_dropoff_datetime: date and time when the passenger was disengaged
- Pickup_longitude/Dropoff_latitude: where the passenger was engaged
- Dropoff_longitude/Dropoff_latitude: where the passenger was disengaged
- Medallion: the ID of each taxi
- The geometry data of taxi zones (in both geojson and shapefile formats) were obtained from CartoDB (provided by Todd W. Schneider). Attributes used are the name and area of each taxi zone.
3. Methodology
We chose Spark to conduct the big data processing for this project. First of all, we manipulated the taxi datasets using map and reduce functions. Next, we built a network model of taxi zones using pysal to find the potential path of empty taxi. Finally, the zones that empty taxis passed through were found using Rtree.
In addition, we also visualized the geographical and temporal distribution of empty taxis in NYC.
Phase 1
First, we used the ReduceByKey function to aggregate the data into keyvalue pairs with date and medallion as key, while the records (pick up location, pick up time, drop off location, and drop off time) of all trips of that medallion on that day as value.
Second, a Reduce function was used to merge all trip records of the same key into a whole list. Also, a pipe was put in front of each drop off location.
Third, we used a Map function to select all drop off and next pick up pairs between two pipes, and simply dropped the first pick up location as well as the last drop off location.
Eventually, a FlatAsMap function was used to separate each drop off and next pick up pair.
In this project, a taxi is considered empty when the time between dropoff and next pickup is longer than 600 seconds. Therefore, in the final step of this phase, we filtered all key value pairs so that only the trips of empty taxis were left.
Phase 2
The target of phase 2 is to build a network among the taxi zones. The nodes of the network were generated by finding centroids of each polygon area form the taxi zones data. In order to find edges, we used the function of buildContiguity with ‘queen’ (A queen weights matrix defines a location’s neighbors as those with either a shared border or vertex (in contrast to a rook weights matrix , which only includes shared borders). Queen matrices are contiguitybased matrices with .gal extensions in GeoDa (as opposed to distancebased weights ))as the criterion in the Pysal package. Also, we manually added edges for taxi zones that are connected by bridges.
Phase 3
RTree was used to apply the keyvalue pairs (output of Phase 1) to the geojson file in order to get the taxi zones where the latitude and longitude of drop off/pick up were located. Next, the shortest path between the drop off zone and next pick up zone was calculated based on
the network model built in Phase 2. Last, functions of FlatAsMap, Map and Reduce were used to generate the total number of empty taxis in each taxi zone for different hours in a day and different days of a week.
The flowcharts of the three phases described above were showed in Figure 1, 2 and 3, respectively.
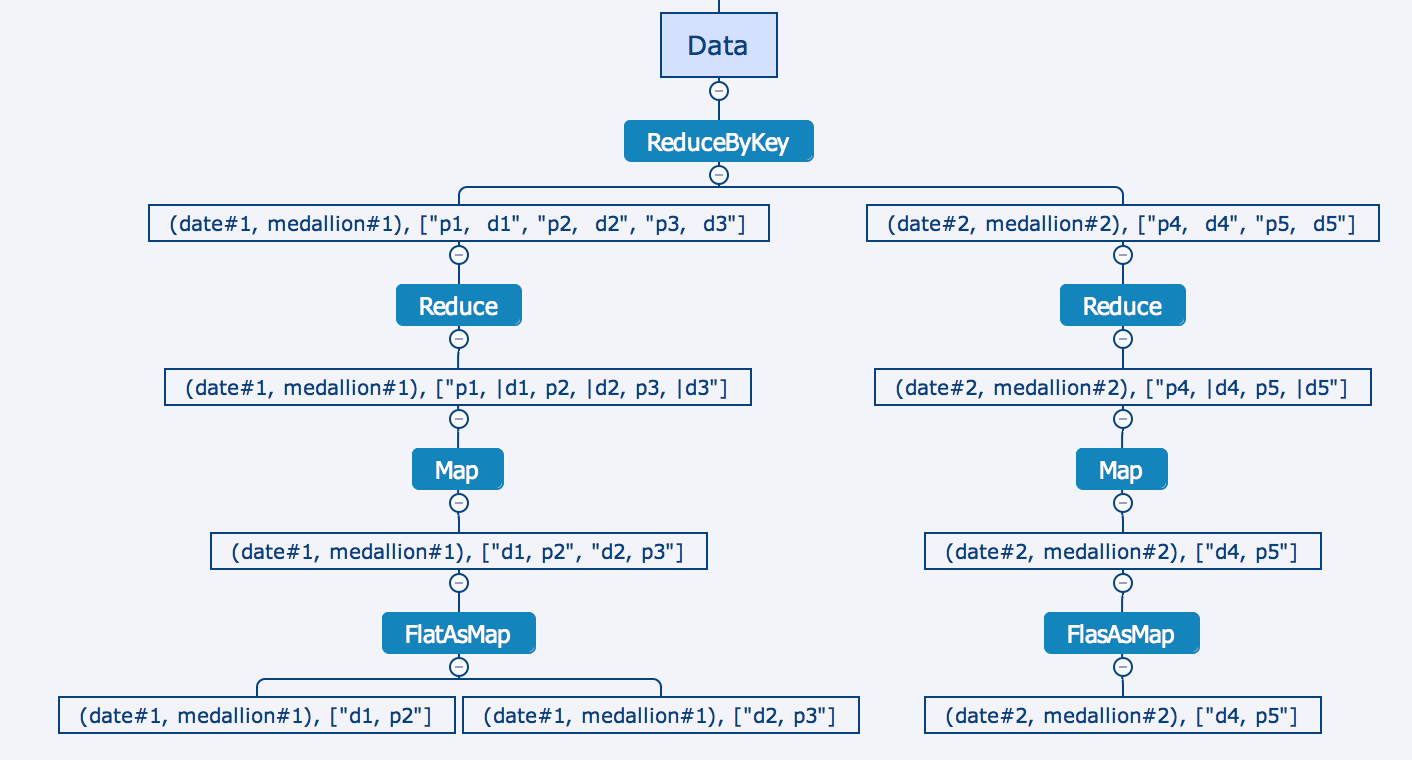
Figure 1: Workflow of Phase 1
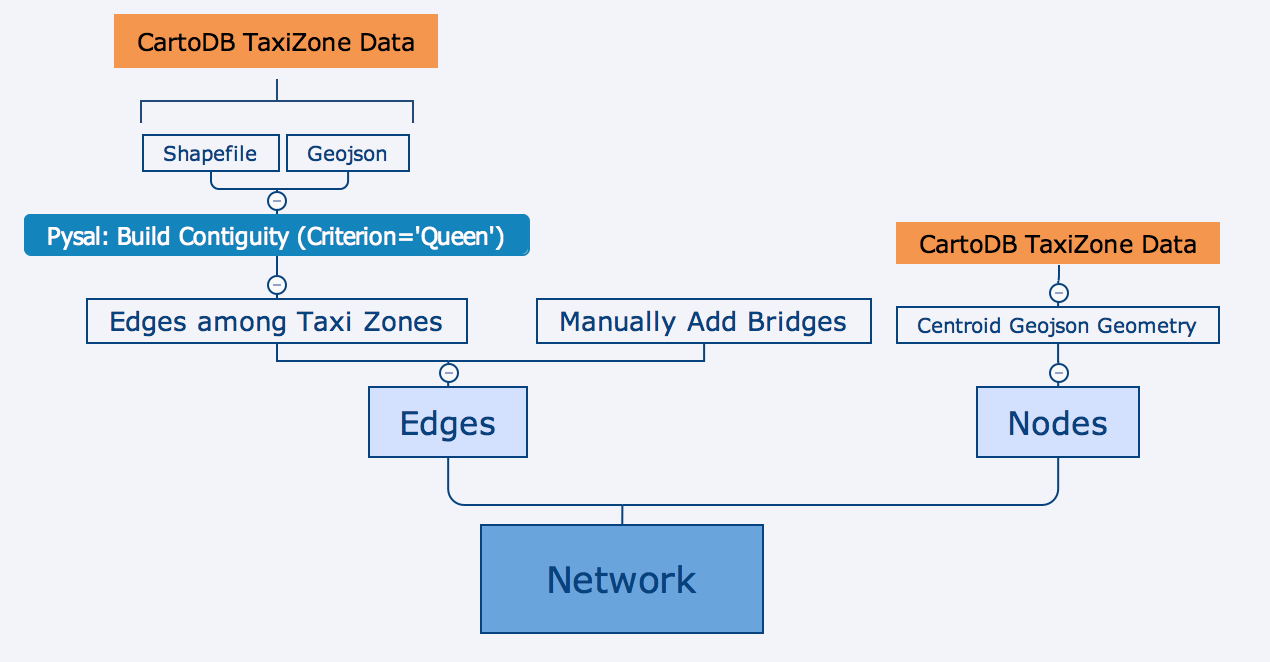
Figure 1: Workflow of Phase 2
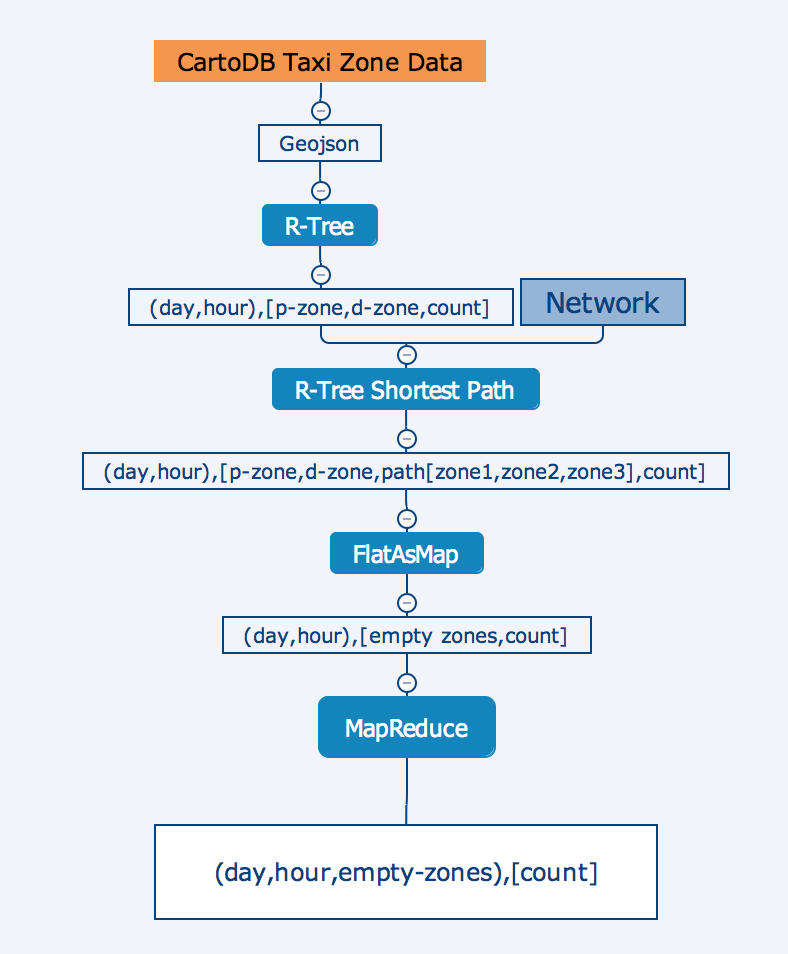
Figure 3: Workflow of Phase 1
4. Results
Figure 4 shows a result as we first glimpsed our output. In this bar chart, the x axis shows the day of week while the y axis shows an aggregate count of the empty taxis in a year for that day. It can be easily observed that Friday and Monday have more empty cabs than the other weekdays. In addition, the number of empty cabs in weekdays outnumbers those at weekends by a huge amount. This result makes sense in the way that there are much less taxis at weekends than in the weekdays.
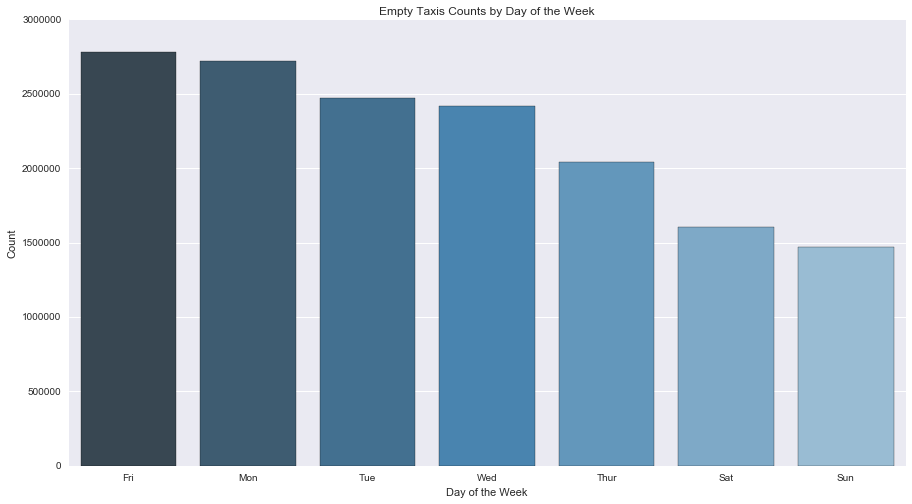
Figure 4: Empty Taxis Counts by Day of Week
Figure 5 shows the count of empty cabs vs the hour of the day. Again, the y axis is the number of empty taxis in a year in a specific hour of the day. The bar chart shows that the amount of empty taxis reach peaks between 7AM to 10AM and between 7PM and 10PM.
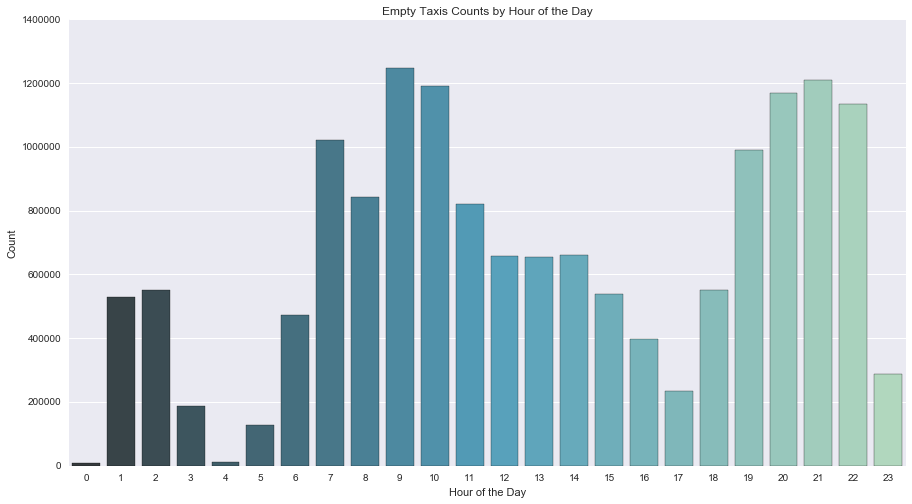
Figure 5: Empty Taxis Counts by Hour of the Day
The left chart in figure 6 shows a network we built by pysal and networkx while the right one shows the real taxi zones of NYC. By comparing the two graphs in figure 6, one can observe that pysal construct the edges of network based on if any of the two zones share borders.
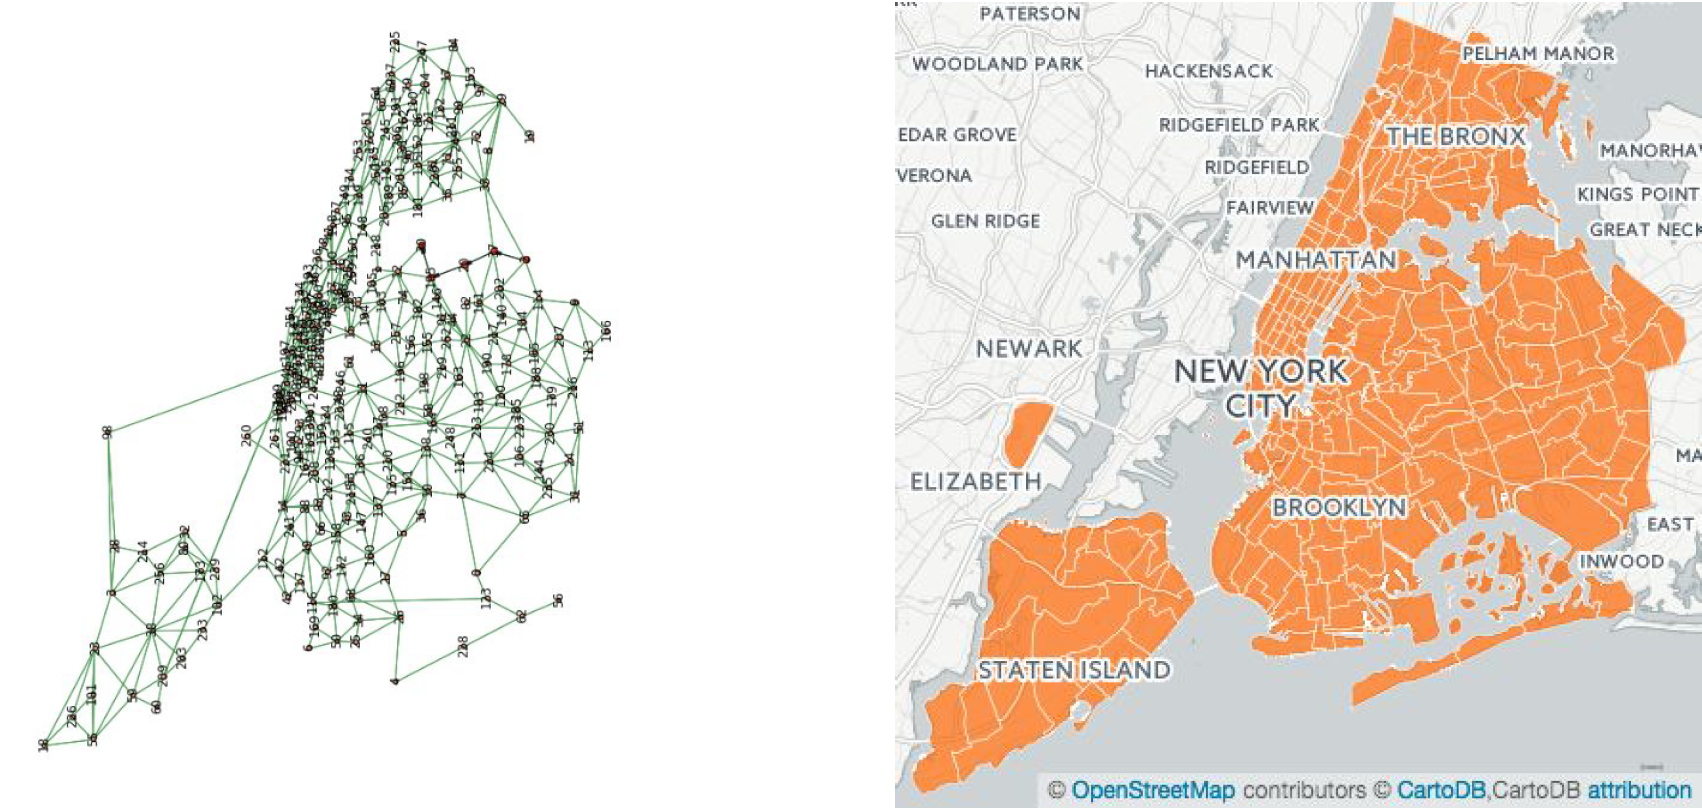
Figure 6: Network of Taxi Zones (left); Real Map of Taxi Zone (right)
Based on the network constructed, we calculated the path between the dropoff and pickup location. After that, we located the taxi zones across these paths and filtered out the zones with most empty cabs to make choropleth maps by 24 hour (figure 7), rush hour (figure 8), and offpeak hour (figure 9). These maps show that Midtown Manhattan and Astoria area have the most severe empty cabs problem (in either rush hours or idle hours). Comparing figure 8 and 9, one can see that there are many empty cabs in Northern Brooklyn during rush hours but there is far less of them during off-peak hours. Also, as expected, there are also some moderate empty cabs problem for areas with airports. However, the problem is generally worse during off-peak hours especially for the case of Newark Airport.
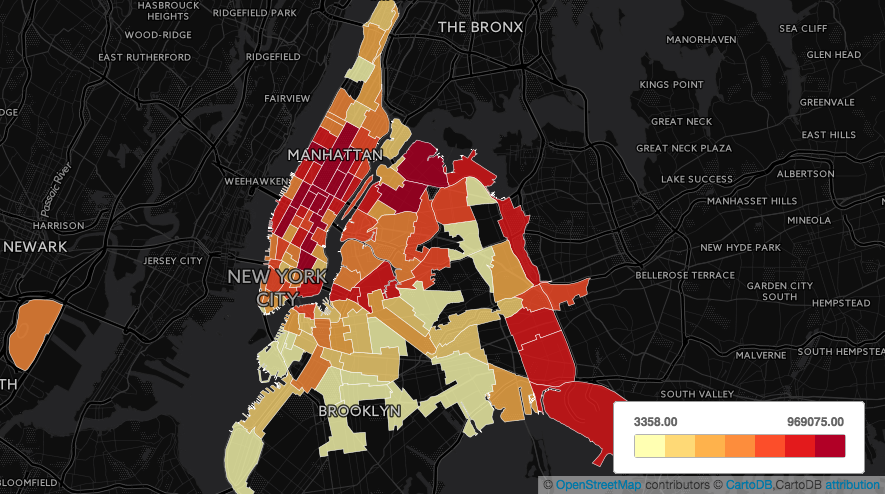
Figure 7: Choropleth Map of Empty Taxis’ Distribution in 24 Hour
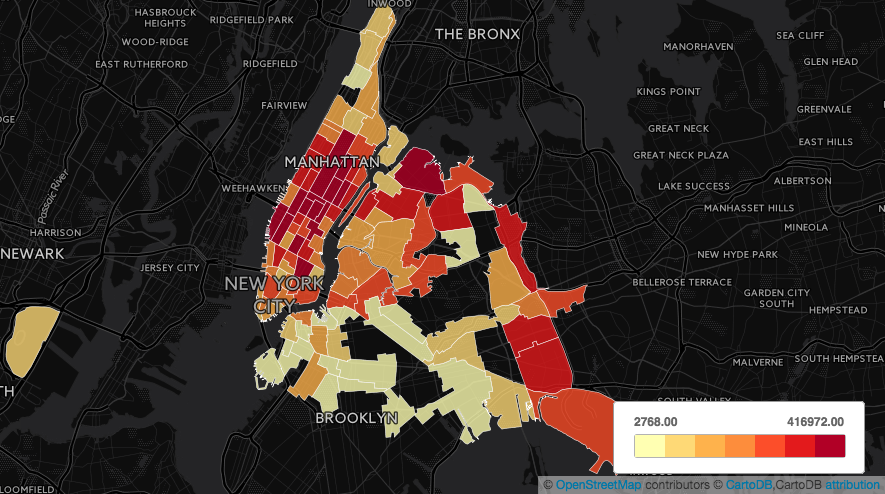
Figure 8: Choropleth Map of Empty Taxis’ Distribution in Rush Hour

Figure 9: Choropleth Map of Empty Taxis’ Distribution in Off-peak Hour
5. Discussion
As shown in figure 5, the amount of empty taxis reach peaks between 7AM to 10AM and between 7PM and 10PM. It maybe a bit counterintuitive since there should be rush hours in this two time windows. Our guess is that: there maybe more taxis in the rush hour. In addition, the peak is caused by traffic problem. Anothering interesting finding is that at 8AM, there is a dramatic decrease of empty cabs. We believe that this might correspond to the huge amount of commuting needs in the morning and that could be the reason why there are most empty taxis during 9AM and 10AM since most of the commuting jobs are finished.
From figure 7 to 9, we can conclude that Midtown Manhattan and Astoria area have the most severe empty taxis problem; additionally, airport areas also have some moderate empty taxis issue. These results generally reveals the fact that taxi zones with more traffic and potentially more taxi demands tend to have more empty taxis, which might be a reason why most taxi drivers do not want to leave from these areas. Nevertheless, it should be pointed out that these results are based on the simplified network constructed by PySal (edges were built according solely to the geographical distribution) while the real traffic conditions are much more complicated.